|
|
||
| - Home - Screen Shots - Manuals - Downloads - Developers - | ||
|
|
GCalc Screen ShotsGCalc 3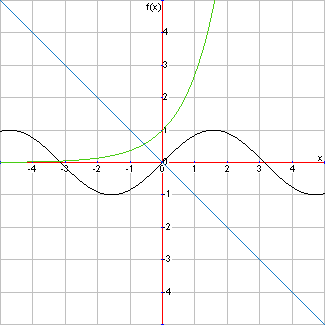 sin(x), -x, and exp(x)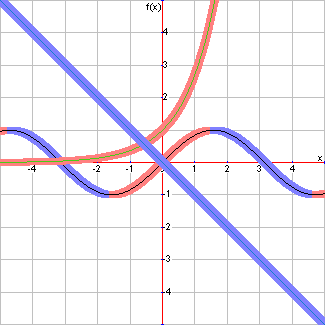 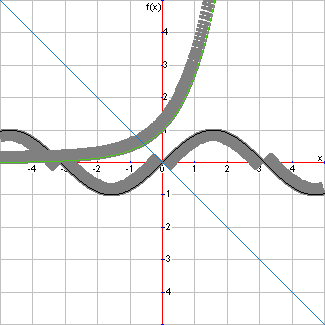 -x has no markings since it's neither concave up nor concave down.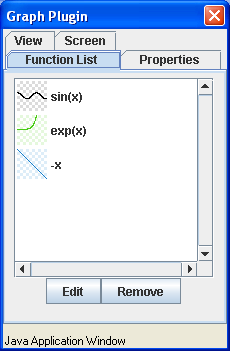 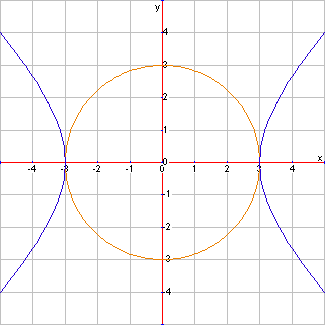 0=x^2+y^2-9 and 0=x^2-y^2-9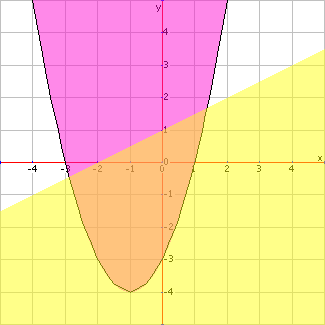 y>=(x+3)(x-1) and y<x/2+1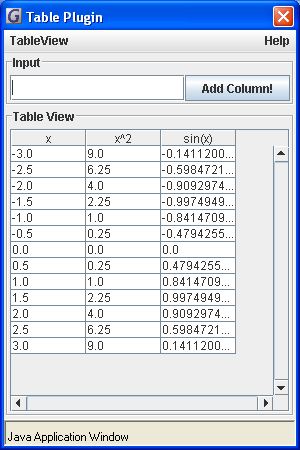 x^2 and sin(x)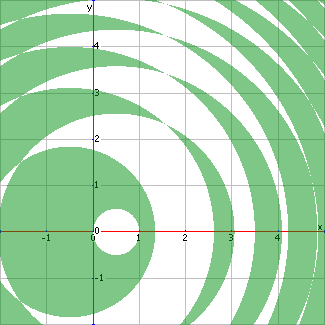 sin(x^2+y^2)>sin(x)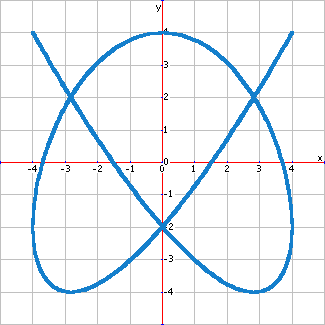
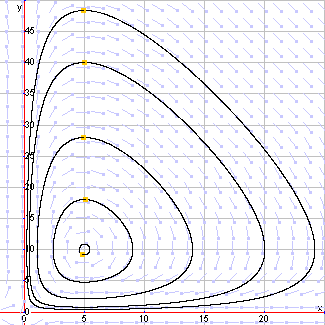
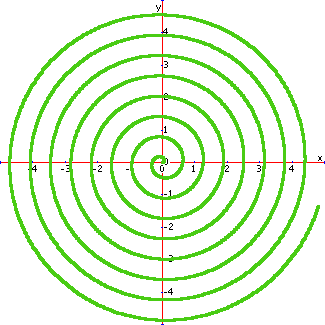 r(t)=t/10 from t=0 to t=50 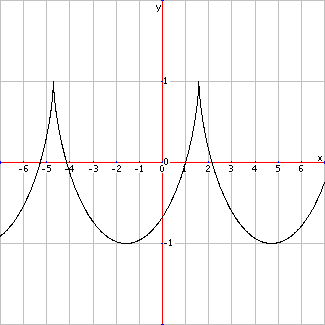
This is the famous Brachistochrone curve.  GCalc 2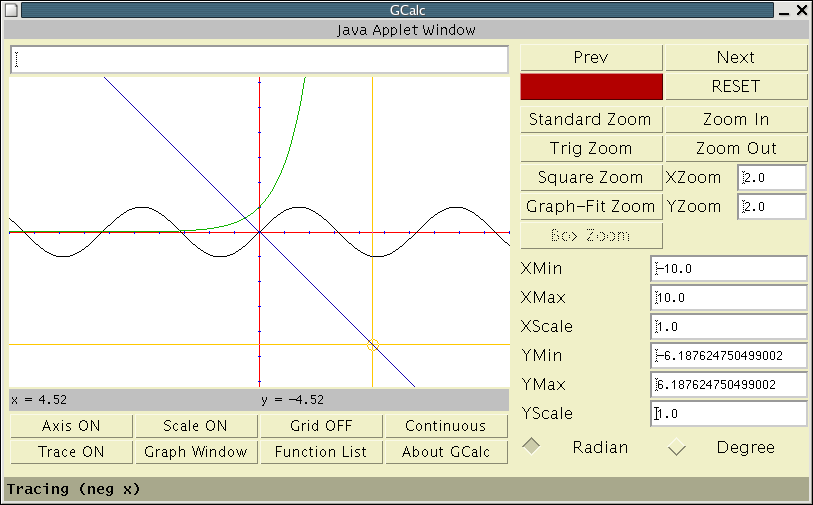 If you have any interesting screen shots, please email them!
| |
| © Copyright 2015 Jiho Kim | ||
About GCalc Support GCalc Acknowledgement